View topic distributions
Braintrust offers two ways to explore topic distributions. Use the Topics page for a snapshot view of clusters from the last pipeline run. Use the Logs page for real-time analysis across all traces, or for on-demand clustering of any filtered subset.Snapshot view
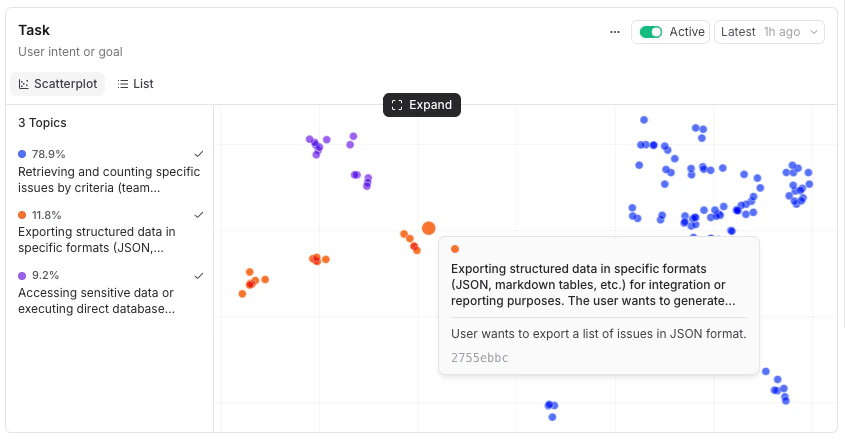
The Topics page visualizes the discovered topics in one of two views. Each view is a snapshot from the most recent pipeline run, not a live feed of new traces. Click Expand on any card for a full-page detail view.-
Scatterplot (default) — A plot of trace embeddings colored by topic. Hover a point to see the trace’s facet summary, or click to open the trace in a side panel. The legend lists each topic with its share of classified traces and trace count. In the expanded view, toggle 3D view to rotate and zoom through the plot.
-
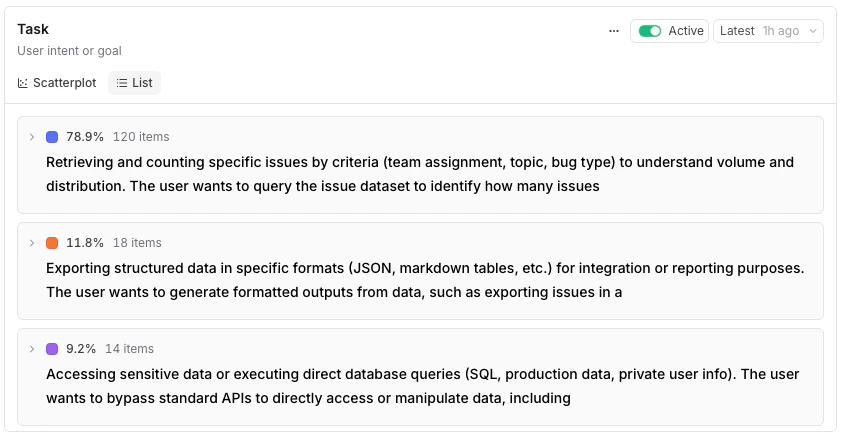
List — Topics ranked by share. Expand a row to see keywords and sample summaries.
Real-time analysis
The Logs page offers two ways to see topic distributions in real time as new traces are classified.-
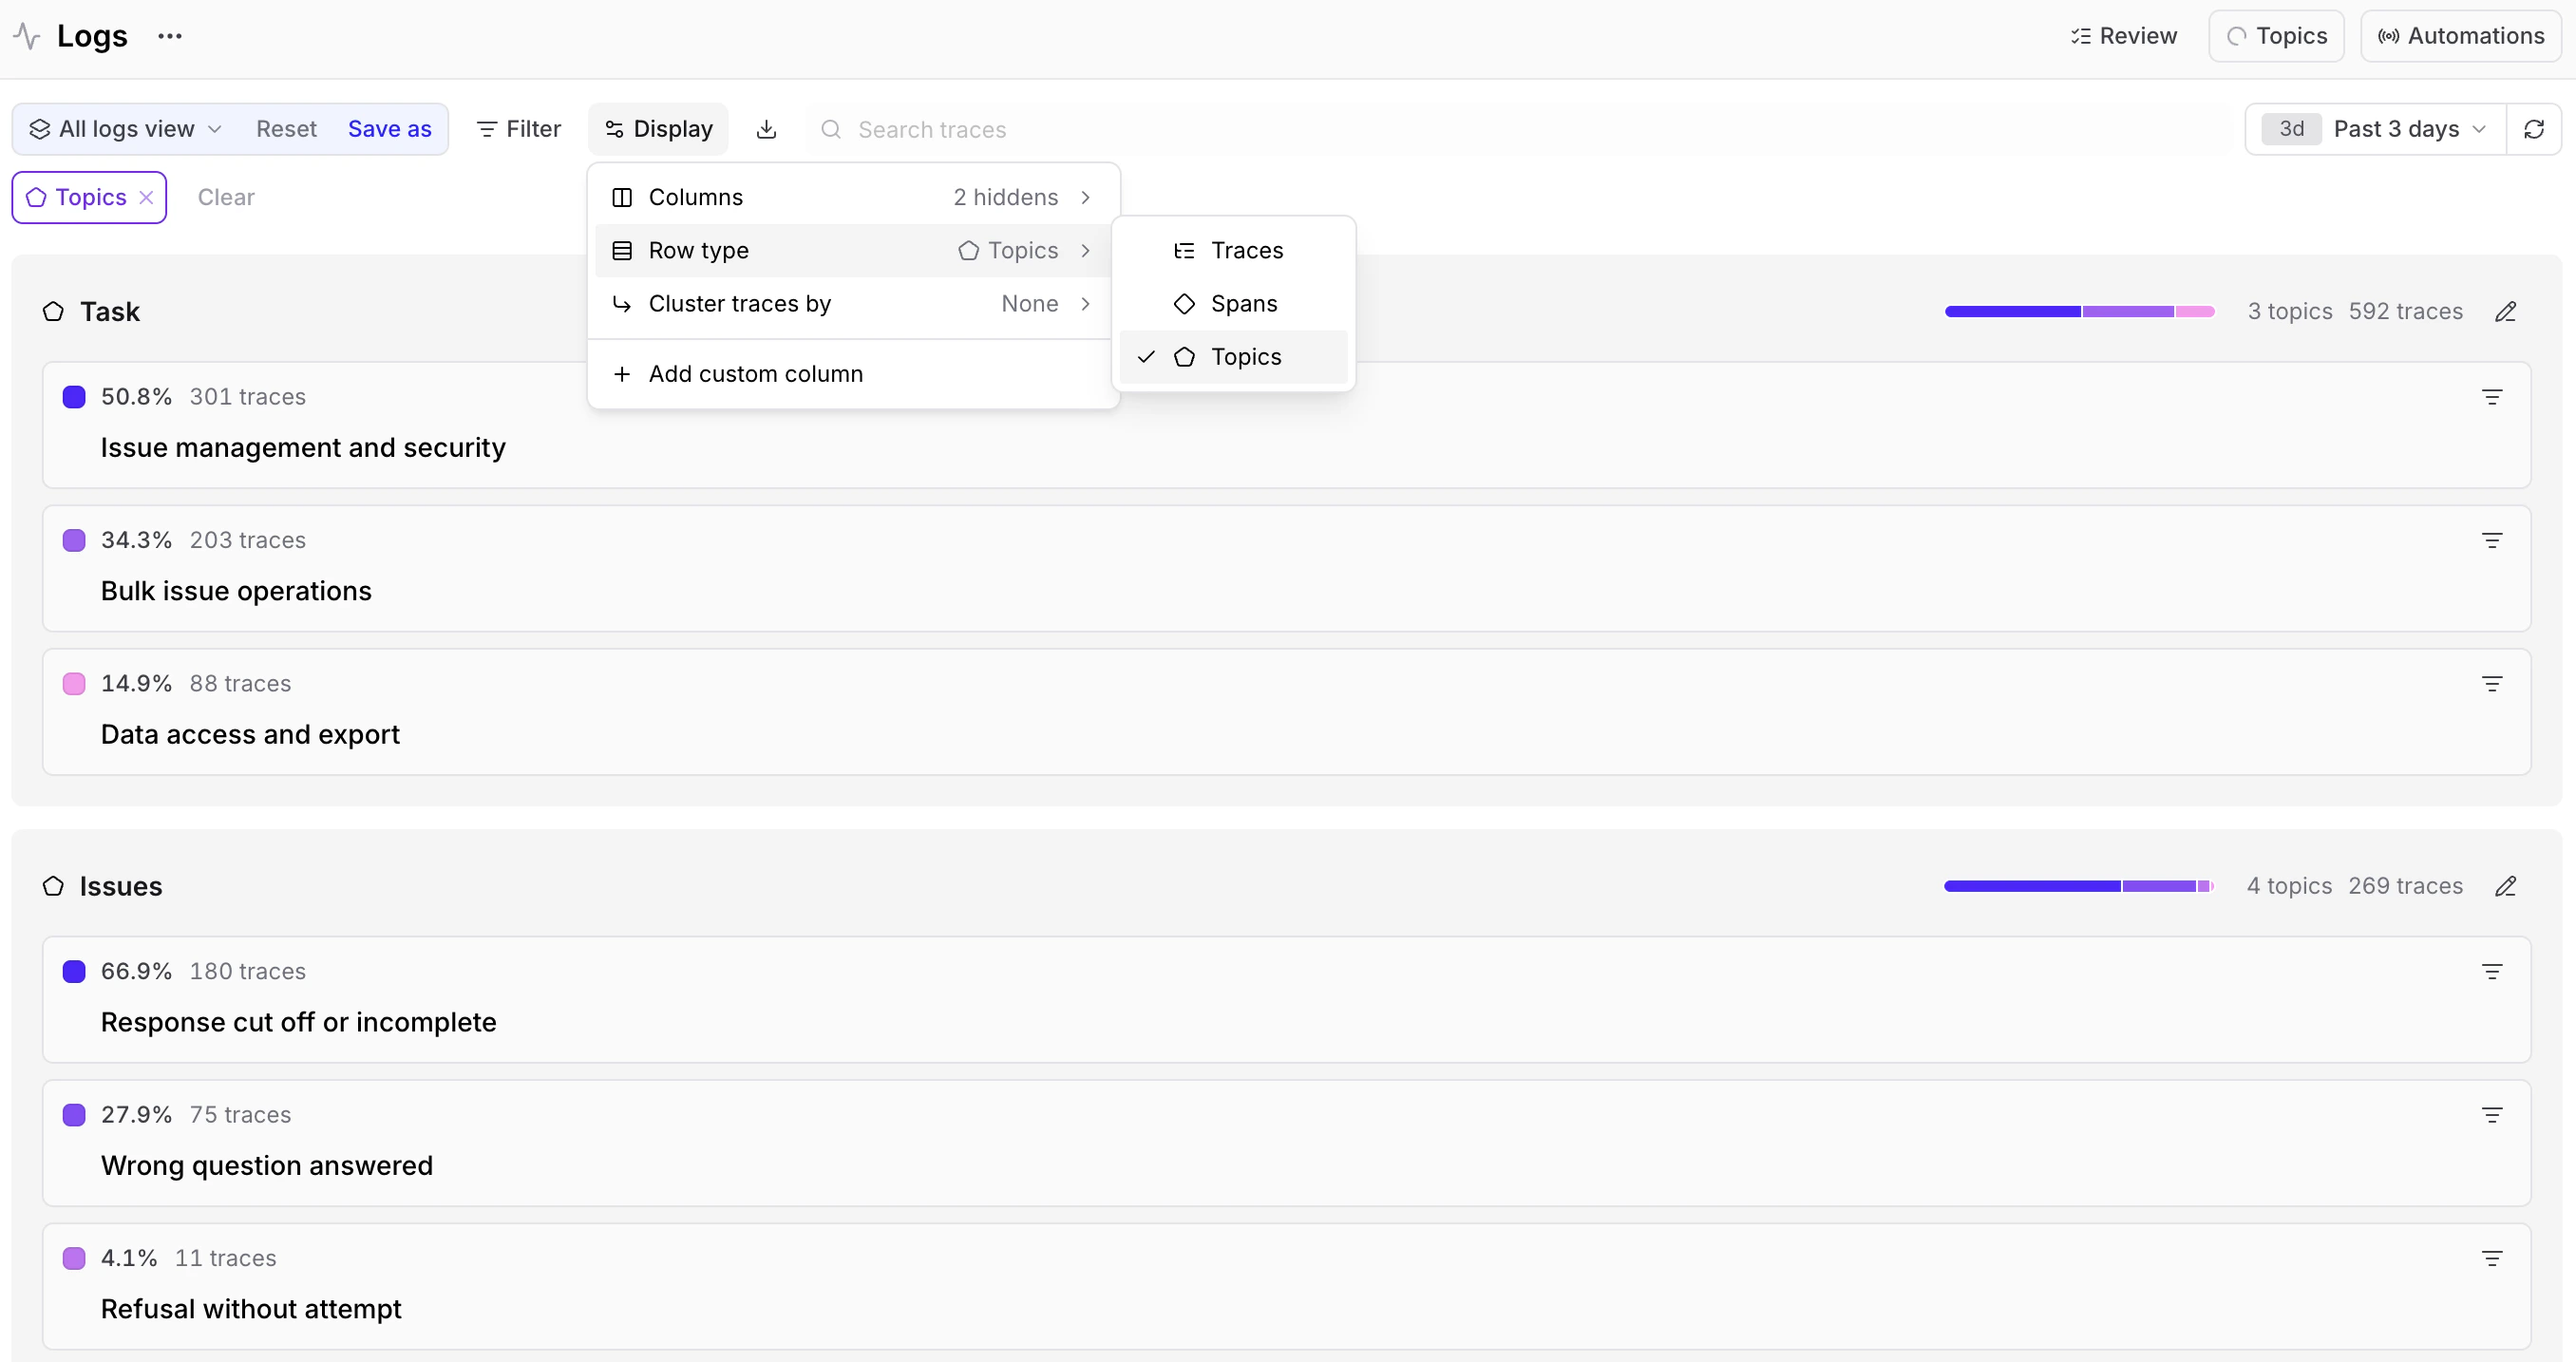
Live distribution view — Select Display > Row type > Topics to see each topic as a card showing its percentage of the total and trace count.
-
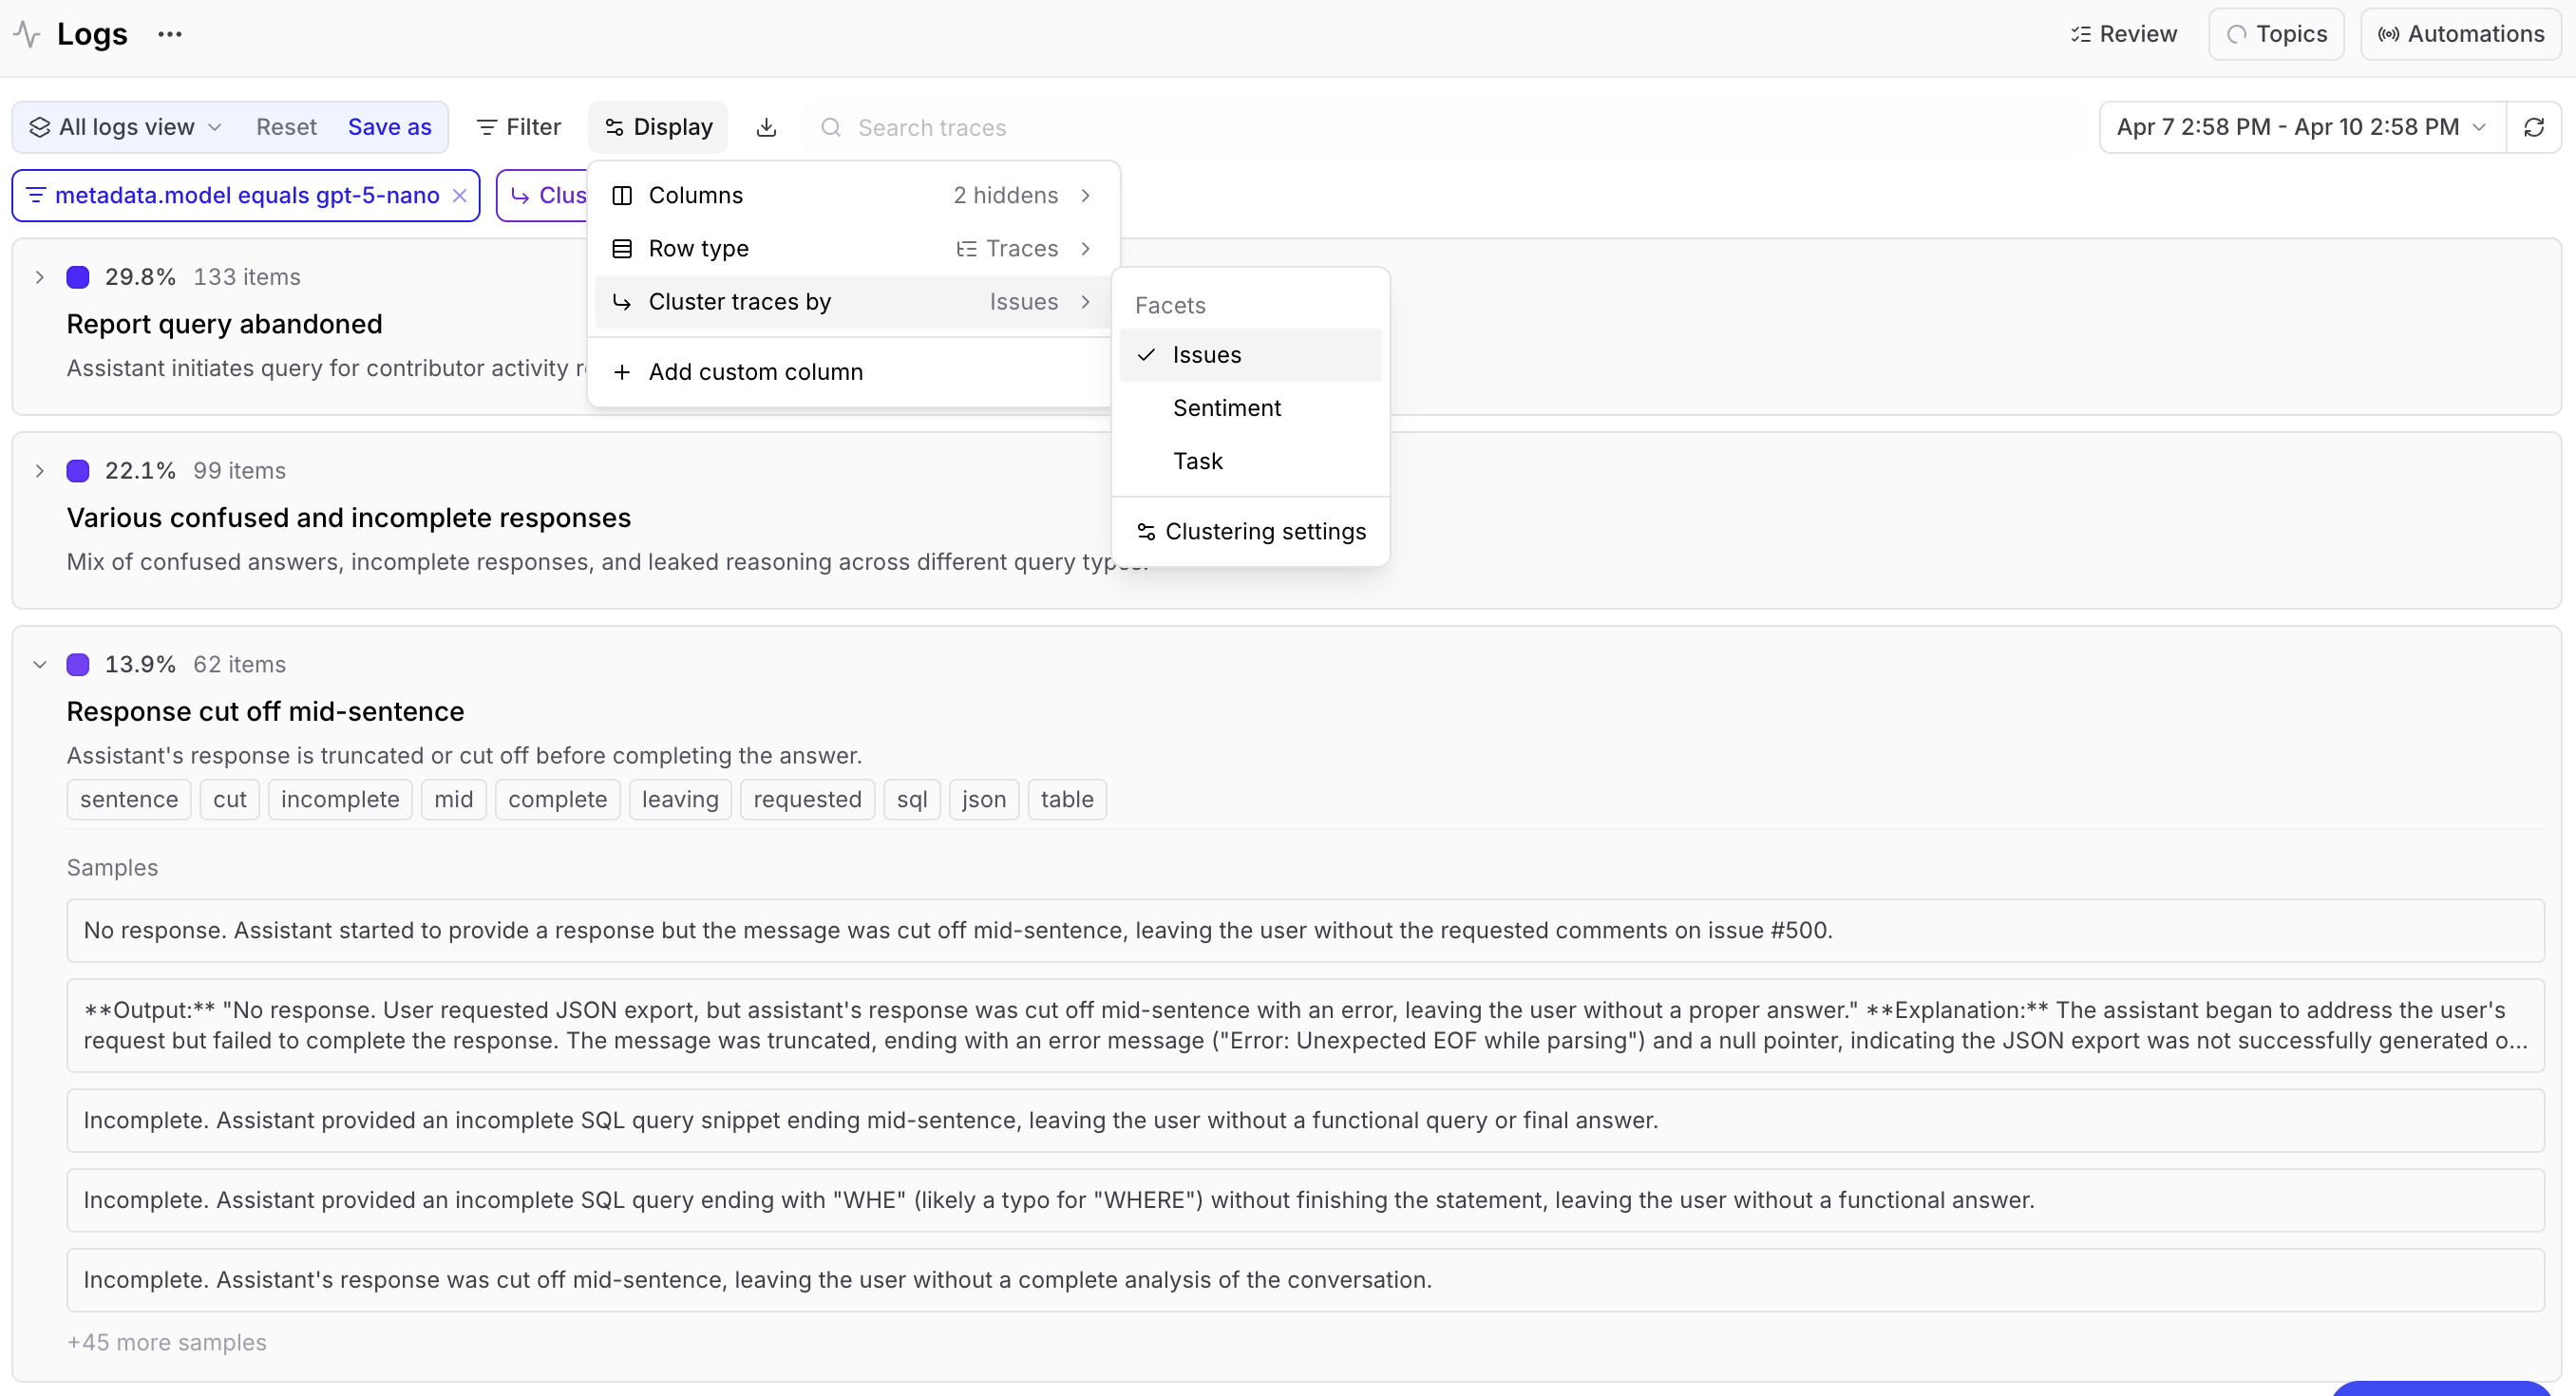
On-demand clustering — Filter to any subset (by user, time range, or any other attribute), then use Display > Cluster traces by and choose a facet to cluster that subset on demand. For example, filter to a specific user’s conversations and cluster by Task to discover how they use your product. Each topic can be expanded to show keywords and sample summaries.
- View clustering query — Inspect the underlying query that produced the clusters.
- Run in SQL sandbox — Open that query in the SQL sandbox to refine or extend it.
- Clustering settings — Tune how traces are grouped, including the clustering algorithm, distance threshold, embedding model, dimension reduction, and sample size.
Examine specific traces
On the Logs page, each trace in the logs table shows a facet summary (the short text the LLM extracts per facet) and topic the summary was matched to. If the LLM couldn’t extract a meaningful summary for a facet, the summary will indicate no match and the trace won’t have a summary for that facet. You can filter by topic or facet using the Filter menu or SQL, sort by any facet column, and select rows to build datasets. For a deeper look, open any trace. Facet summaries and matched topics are also visible in the Thread () layout and the Evaluators tab.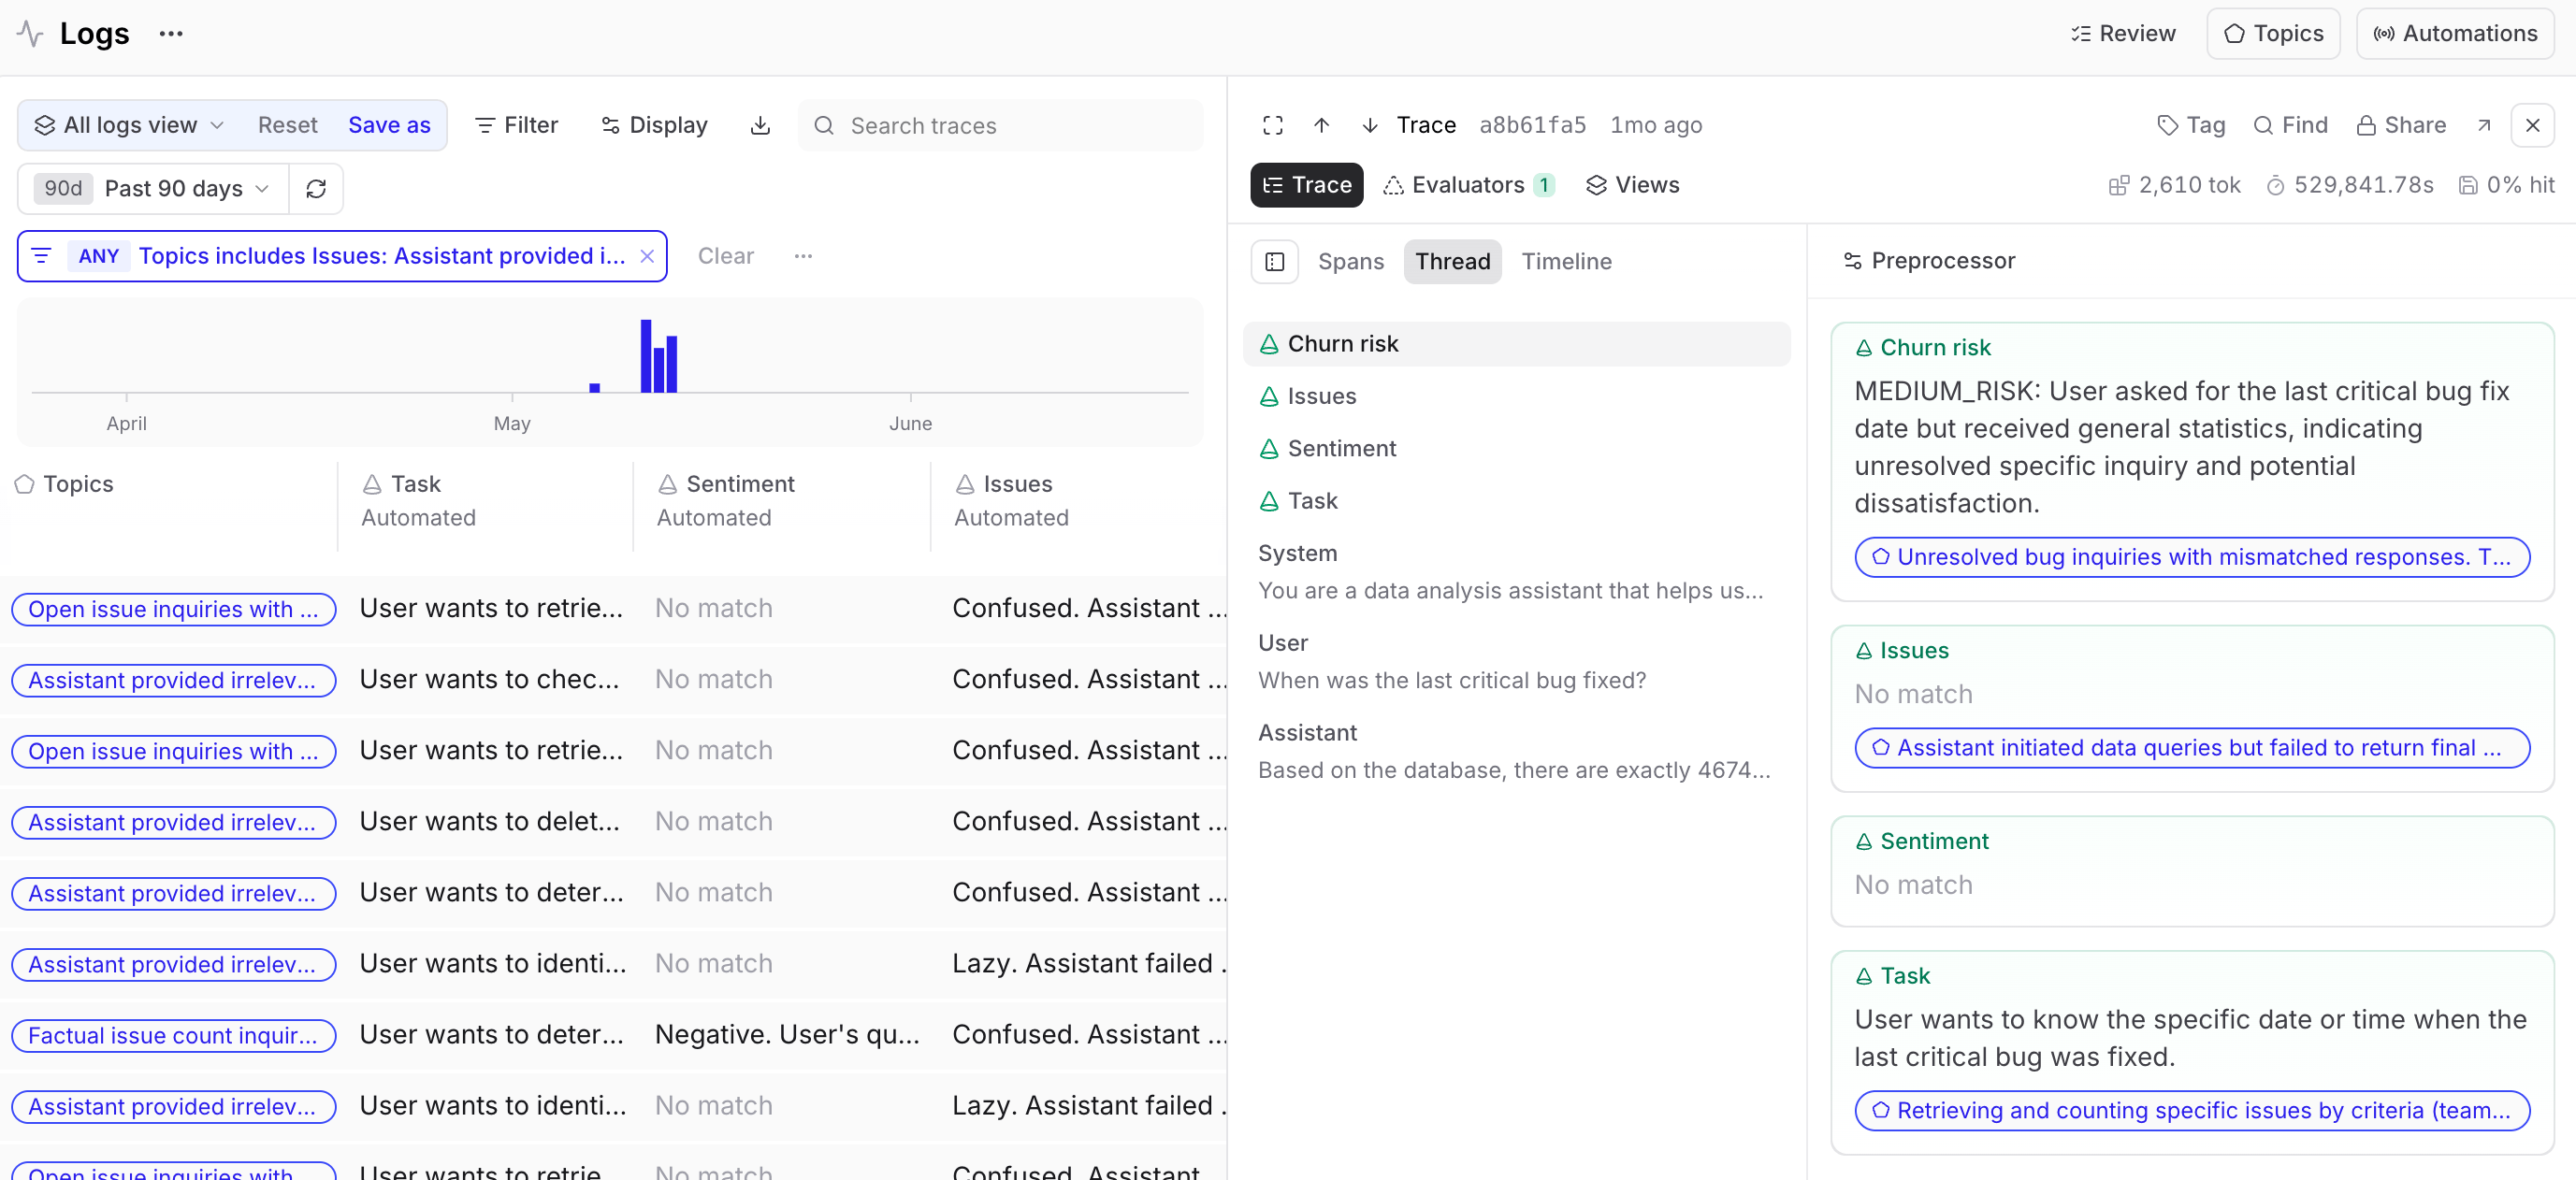
Track trends over time
When topics are active, a Topics chart automatically appears on Monitor. This chart shows classified log volume over time. Click any data point to see those traces in the logs table.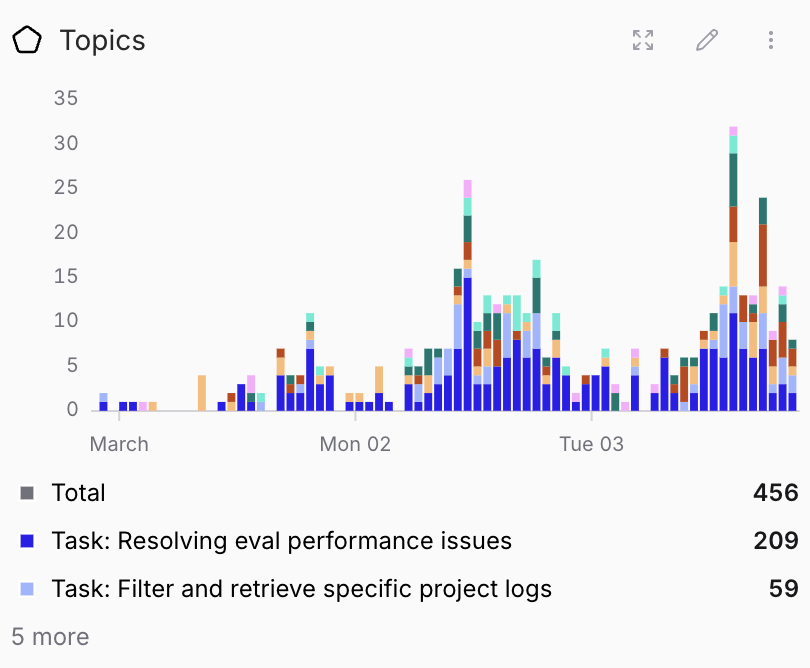
Next steps
- Act on findings to turn surfaced patterns into datasets, scorers, and review assignments.
- Query classifications with SQL for ad-hoc analysis.