> ## Documentation Index
> Fetch the complete documentation index at: https://braintrust.dev/docs/llms.txt
> Use this file to discover all available pages before exploring further.
# Compare experiments
> Identify which test cases improved or regressed between runs. Set a baseline experiment to align test cases and compare score deltas side by side.
Experiment comparison shows you how your changes affected performance — which test cases improved, which regressed, and by how much. When you select a baseline, Braintrust aligns test cases across experiments and adds score deltas to every row, with improvements highlighted in green and regressions in red.
Use comparison to:
* **Find what broke**: Sort by regressions to surface the test cases most affected by your change, then use diff mode to see exactly what the model output differently.
* **Assess overall impact**: Switch to an aggregate layout to see whether a run improved overall across all test cases.
* **Share results**: Export the Summary table as a PDF to report findings to stakeholders.
Experiment comparisons require trace-level rows. Select **Display** > **Row type** > **Traces** to enable comparison mode.
## Open a comparison
To start comparing experiments:
1. Go to [** Experiments**](https://www.braintrust.dev/app/~/experiments).
2. Select the checkboxes next to the experiments you want to compare.
3. Click **Compare** in the toolbar.
Alternatively, open an experiment and use the **Comparisons** selector in the sidebar to choose one or more experiments to compare against.
Once you're in comparison mode, a score delta column appears in the table and each row is color-coded: green for improvements, red for regressions.
## Set a baseline
The baseline is the experiment your current experiment is compared against. Setting a persistent baseline means you don't have to reselect it each time you open the experiment, and ensures consistent comparisons in CI.
To set the baseline for an experiment:
1. Open the experiment you want to set as the baseline.
2. In the **Comparisons** selector in the sidebar, hover over the experiment you want to set as the baseline.
3. Click **Set as baseline**.
It will be auto-selected whenever you open that experiment. To unset the baseline, click **Clear baseline**.
You can also set a [project-wide default baseline](/admin/projects#set-a-default-baseline) that applies to all experiments in the project. When both an experiment baseline and a project default are configured, use **Comparisons** > **Prefer default baseline over experiment baseline** to control which takes priority.
If no baseline is set, Braintrust automatically selects the most recent experiment on the same git branch (when experiments are [run with git metadata](/kb/running-evaluations-per-git-commit-sha)). Use **Comparisons** > **Auto-select a comparison experiment by default** to disable this behavior.
## Set a comparison key
Braintrust matches test cases across experiments using the `input` field by default. Test cases with identical inputs are treated as the same example. If your experiments share a consistent input structure, no configuration is needed.
If your `input` includes fields that vary between runs (such as timestamps or session IDs), configure a custom comparison key to match on the fields that matter:
1. Go to ** Settings** > [** Advanced**](https://www.braintrust.dev/app/~/configuration/advanced).
2. Under **Comparison key**, enter a SQL expression.
3. Click **Save**.
For example, use `input.user_query` instead of the entire `input` object if other fields vary between runs. You can match on multiple fields using an array: `[input.query, metadata.category]`.
If comparison rows show "-" instead of scores, inputs don't match exactly between experiments. See [Blank comparison rows due to mismatched inputs](/kb/blank-comparison-rows-due-to-mismatched-inputs) for resolution steps.
## Sort by regressions
Sorting by regressions puts the most affected test cases at the top, so you can immediately see what your change broke without scanning every row:
* To reorder columns by regression count, select ** Display > Columns > Order by regressions**.
* To filter to only rows that regressed or improved, click the score value in a column header and select **X regressions** or **X improvements**.
Filter by metadata fields (e.g., category or topic) to see how performance varies by input type.
## Use diff mode
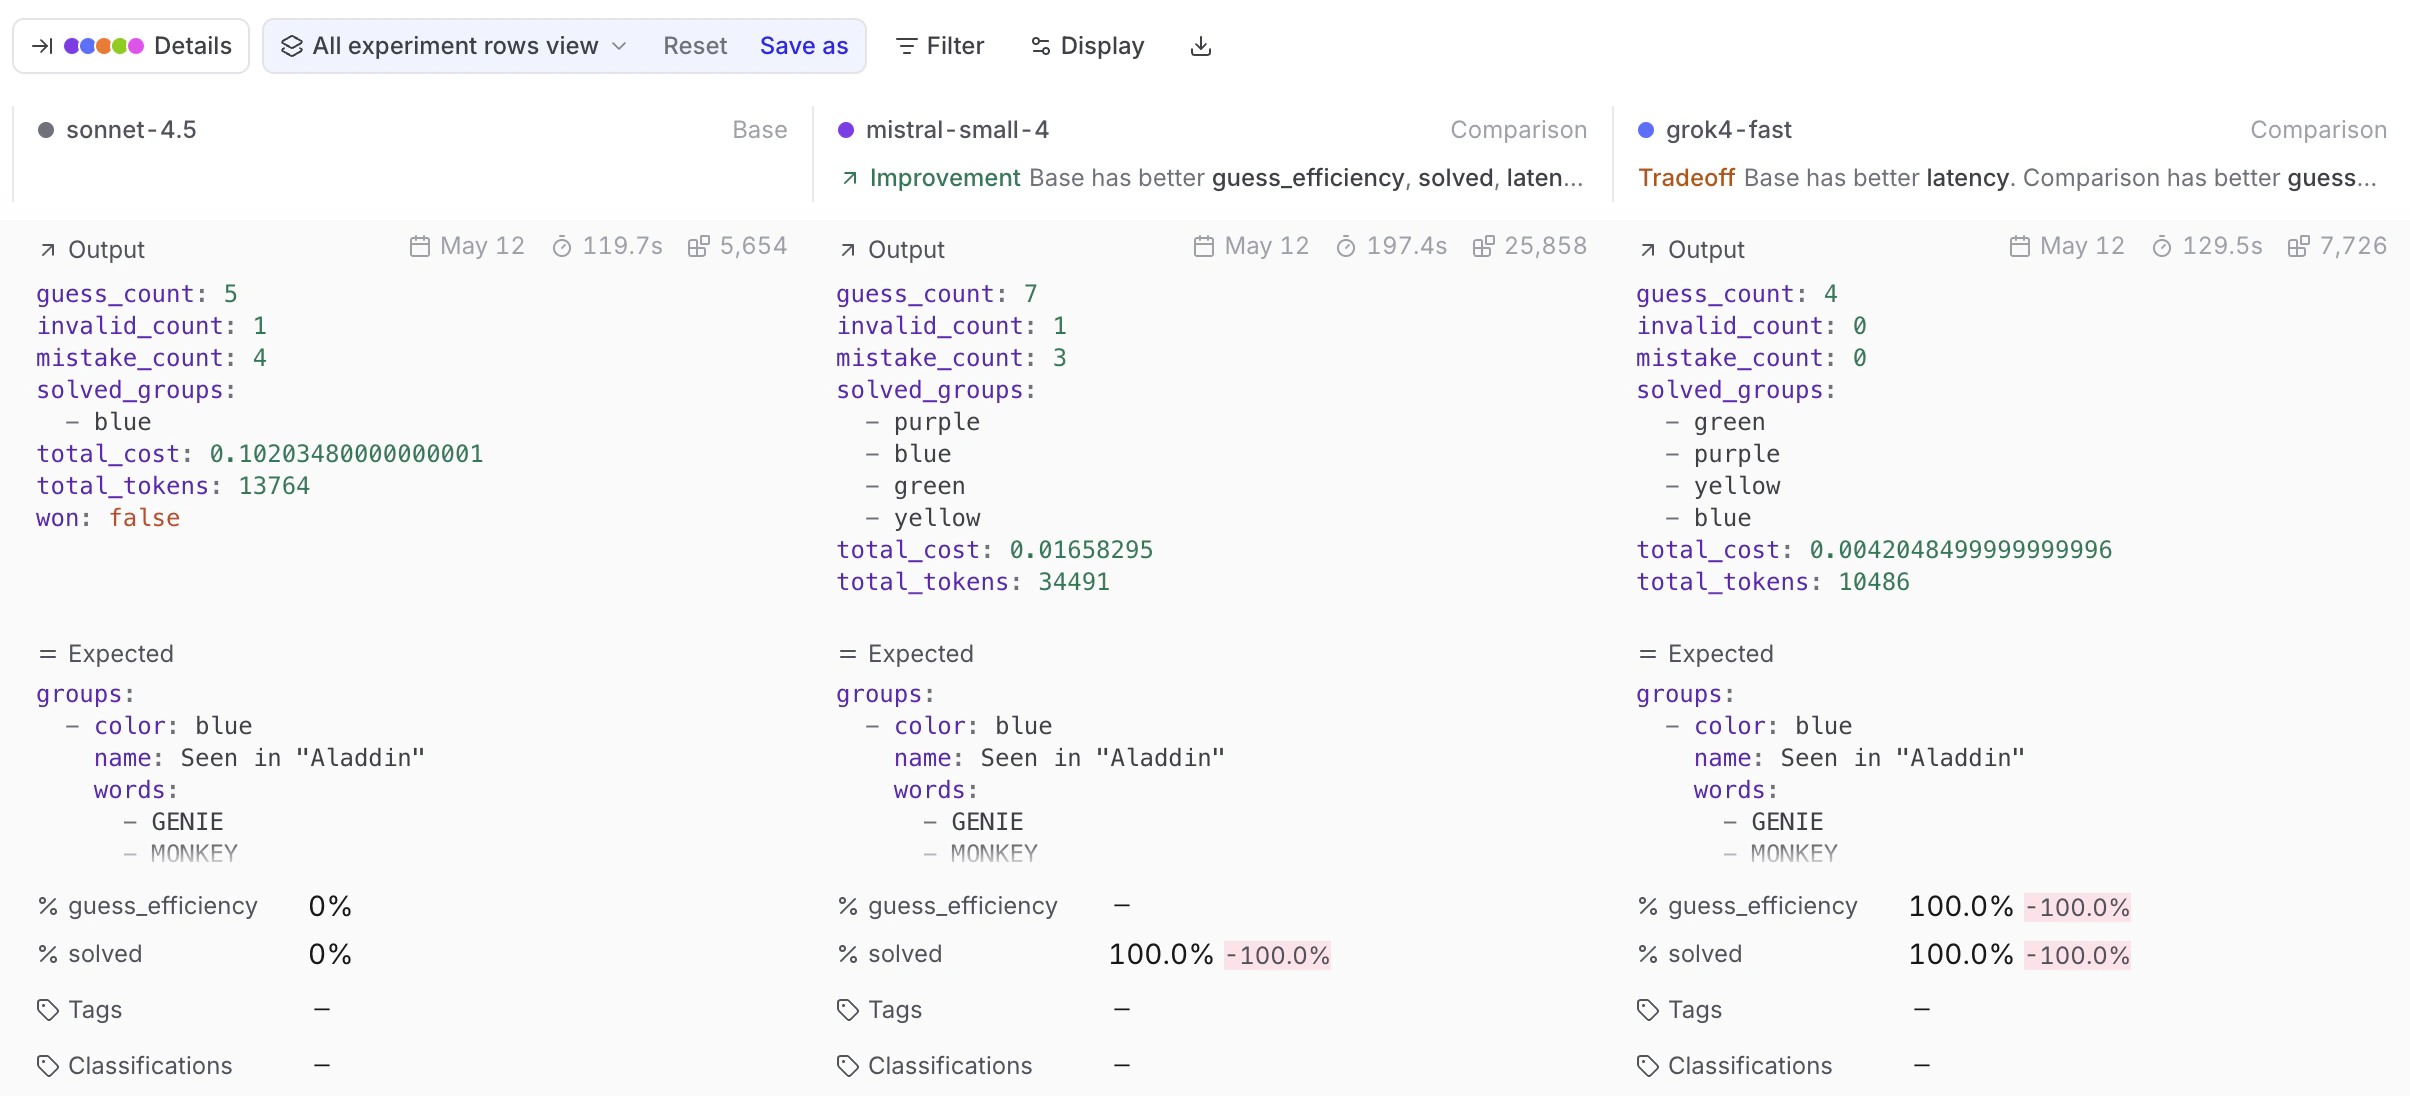
Sorting tells you *that* a test case regressed — diff mode tells you *why*. Enable the **Diff** toggle in the table header to switch the table into diff mode. Each test case expands to show a sub-row per experiment, so you can compare outputs, scores, and metadata inline without opening individual rows.
Use the sub-mode selector next to the toggle to choose:
* **Experiments** — Compare outputs across experiments side-by-side.
* **Output vs. expected** — Diff output against expected within a single experiment (only available when the experiment has an `expected` field).
Click any row to open the detail panel for a character-level diff of that test case.
[Timeline](/observe/examine-traces#view-as-a-timeline), [Thread](/observe/examine-traces#view-as-a-conversation), and [custom views](/annotate/custom-views) are disabled in diff mode.
The diff view has a 4,096-character limit per field. If your prompts or outputs are longer, consider logging them as structured objects (e.g., separate `system_prompt`, `context`, and `user_query` fields) so each component can be diffed independently.
## Assess overall impact
When comparing experiments, switch to an aggregate layout to see overall impact rather than scanning row by row. Use **Display** > **Layout**:
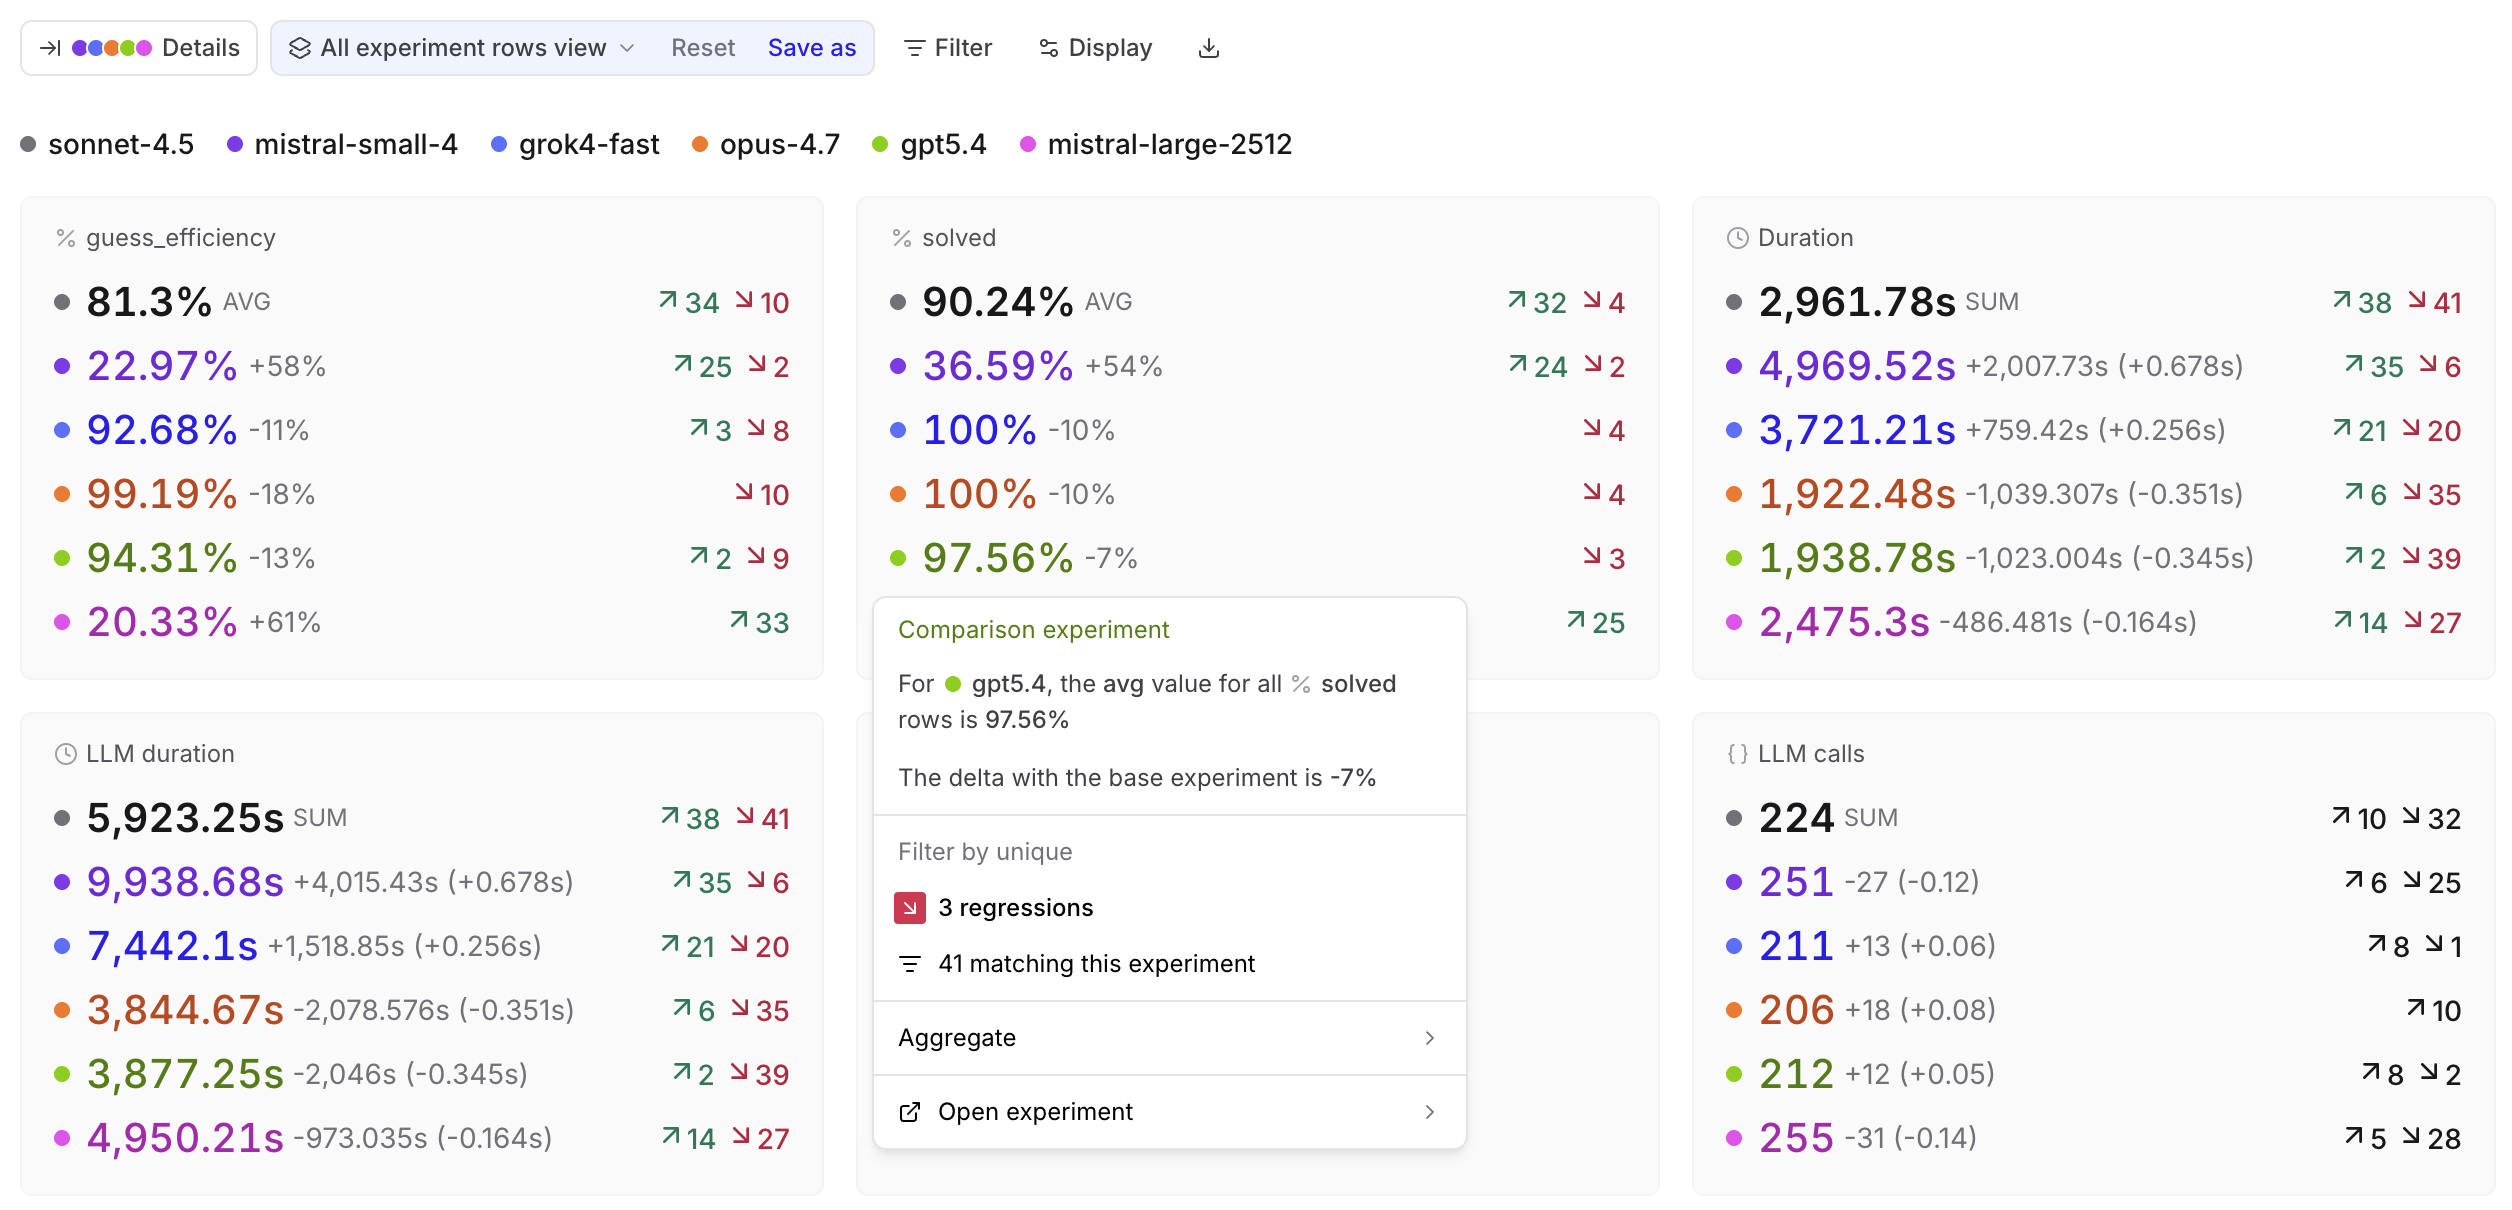
* **Summary**: Score and metric cards showing aggregate values per experiment.
Click any card to open a menu with the aggregate value, delta vs. base, filters for improvements, regressions, or matching rows, and an aggregation selector. Comparison cards also link to the comparison experiment at the matching rows.
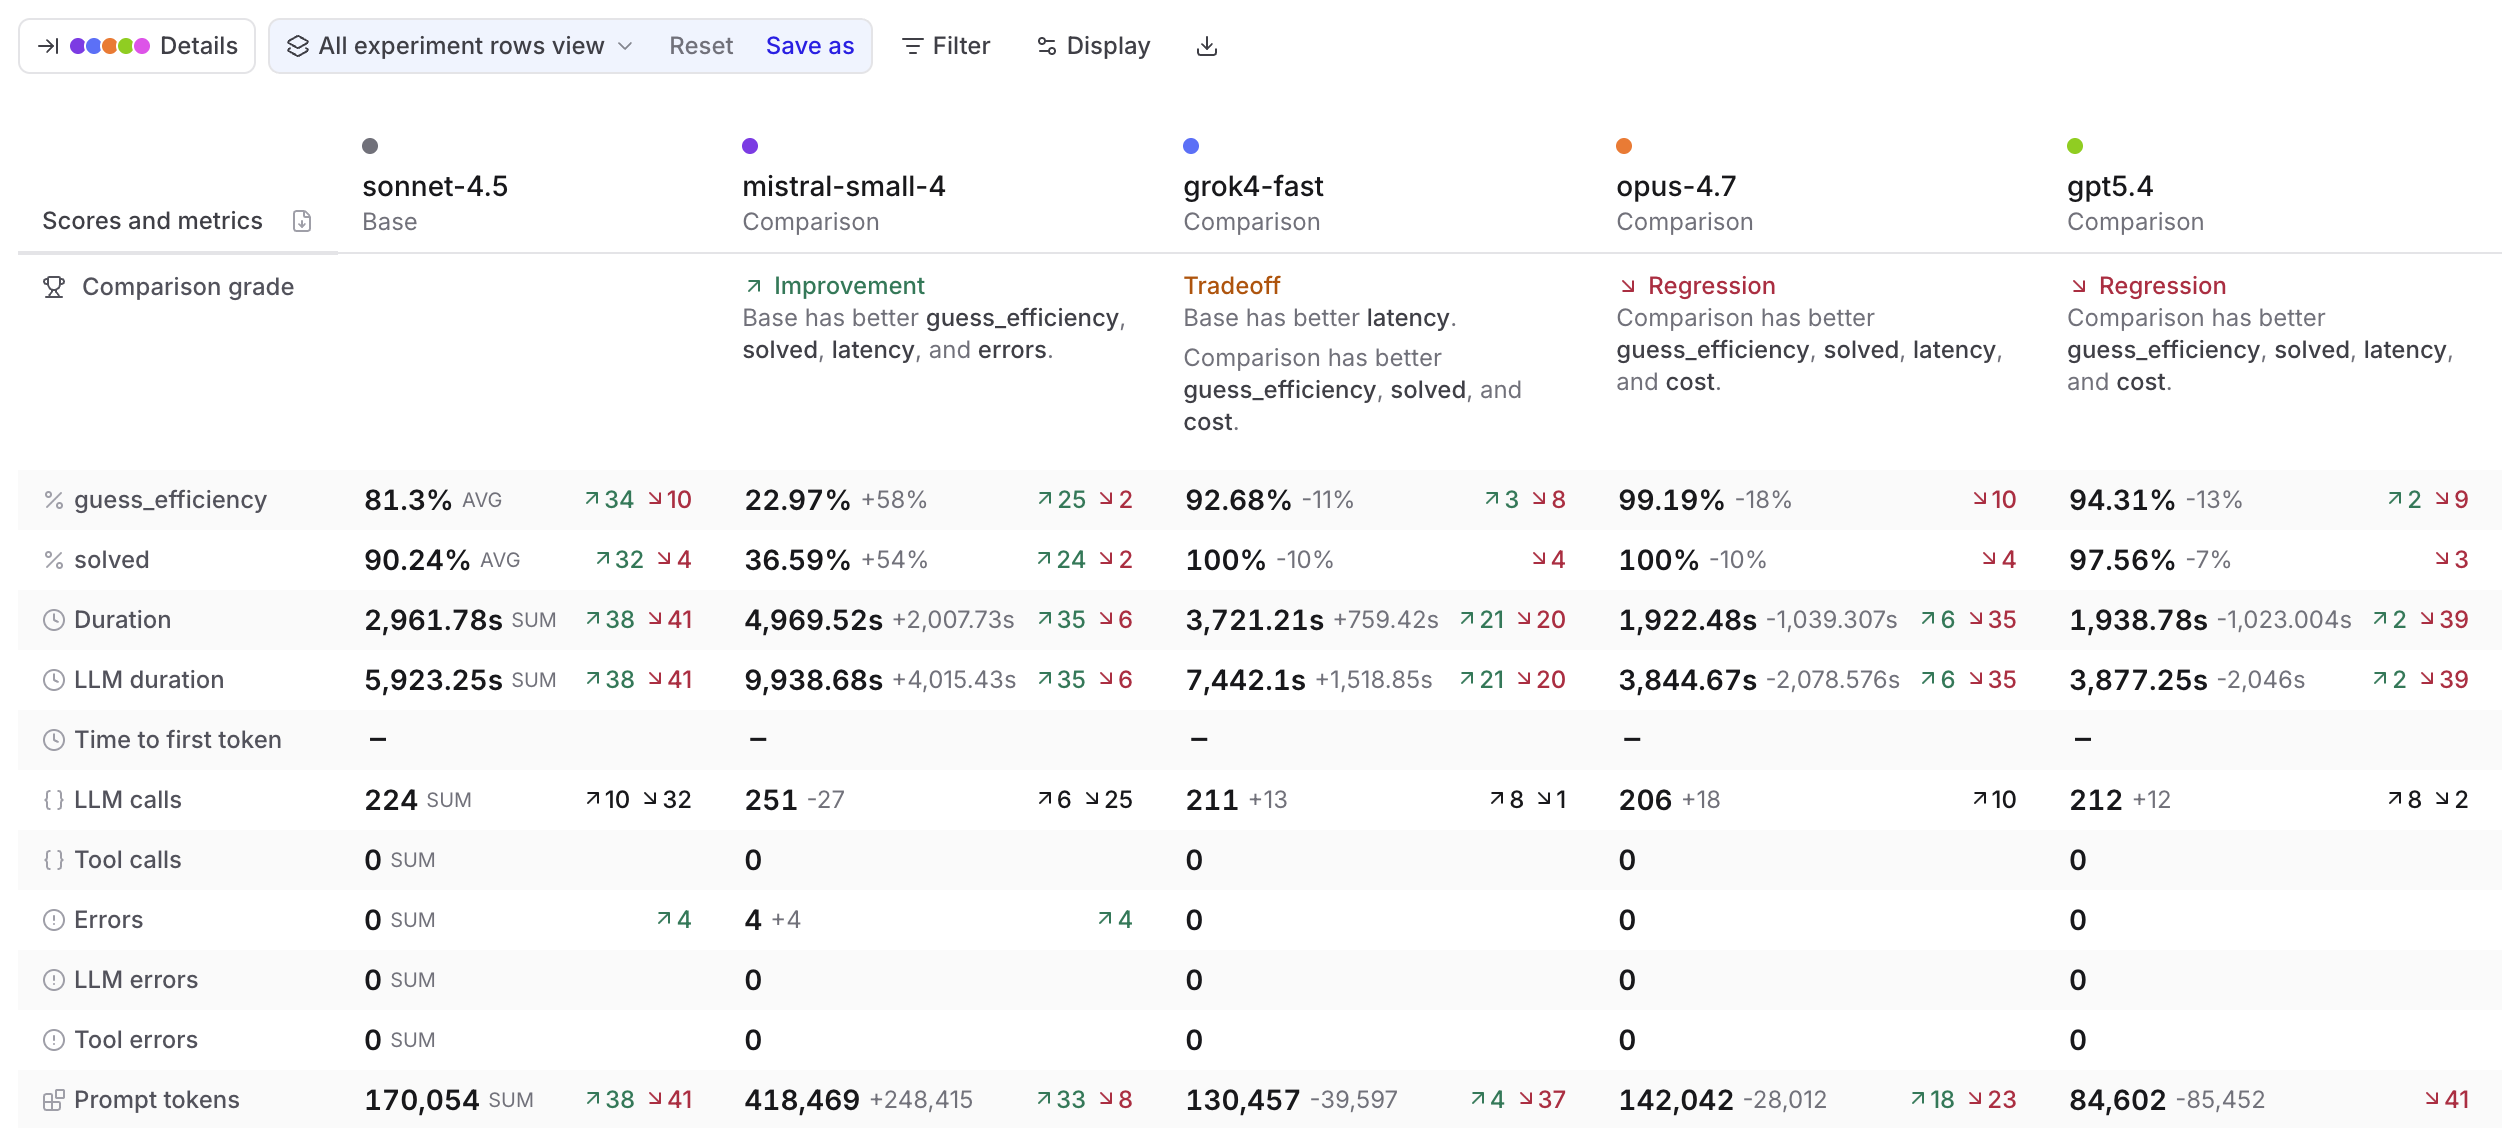
* **Summary table**: Scores and metrics as rows with base and comparison experiments as columns.
The ** Comparison grade** row tells you whether each experiment is an **Improvement**, **Regression**, **Tradeoff**, or **Tie** versus the base. The grade considers scores and metrics across four categories: latency, cost, errors, and load.
Click any cell to open the same details menu as in the Summary layout.
* **Grid**: View fields for each test case as a stacked card. Use **Display** > **Fields** to select which fields to show.
Each comparison experiment's column header shows a comparison grade (Improvement, Regression, Tradeoff, or Tie) relative to the base, using the same grading described under **Summary table**.
Summary and Summary table layouts hide individual test case rows. Switch to **List** or **Grid** to drill into specific test cases.
## Share results
Braintrust gives you several options depending on who you're sharing with and what they need to do with the results.
* **Download as CSV or JSON** — for further analysis, importing into another tool, or sharing raw data. Click **Download** in the toolbar and choose a format. Capped at 1,000 rows in the UI. Use the [API](/api-reference) for larger exports.
* **Share a link** — Give teammates or stakeholders direct access to the experiment in Braintrust. Use the **Share** button in the top right to toggle between public and private visibility and copy the URL. Your collaborators must be members of your organization to view the experiment. You can invite users from the settings page.
* **Download as PDF** — Export a formatted summary for a doc, presentation, or for people without Braintrust access. Switch to **Summary table** layout and click the **Download as PDF** icon in the table header. The print view includes the org and project name as a header.
## Compare trials
When you run multiple [trials](/evaluate/run-evaluations#run-trials) (repeated evaluations of the same input), grouping by input collapses all trials for the same input into a single expandable group. The group header shows aggregate stats; expand it to see individual trial rows. This makes it easy to spot inputs where the model behaves inconsistently — instability that a single-run comparison would miss.
To group by input, select **Input** from the **Group** control in the toolbar. This option is only available when the experiment was run with trials.
## Compare programmatically
Use the SDK to compare experiments in scripts or CI pipelines, and access score deltas programmatically.
### Use the SDK
Pass `baseExperiment` / `base_experiment` (or `baseExperimentId` / `base_experiment_id`) when initializing an experiment to compare against a specific baseline. The `summarize()` method returns per-score improvements, regressions, and diffs:
```typescript theme={"theme":{"light":"github-light","dark":"github-dark-dimmed"}}
import { init } from "braintrust";
const experiment = init("My Project", {
experiment: "new-experiment",
baseExperiment: "baseline-experiment", // or baseExperimentId: "..."
});
const summary = await experiment.summarize();
for (const [name, score] of Object.entries(summary.scores)) {
console.log(`${name}: ${score.improvements} improvements, ${score.regressions} regressions, diff: ${score.diff ?? 0}`);
}
```
```python theme={"theme":{"light":"github-light","dark":"github-dark-dimmed"}}
from braintrust import init
experiment = init(
project="My Project",
experiment="new-experiment",
base_experiment="baseline-experiment", # or base_experiment_id="..."
)
summary = experiment.summarize()
for name, score in summary.scores.items():
print(f"{name}: {score.improvements} improvements, {score.regressions} regressions, diff: {score.diff or 0}")
```
### Use in CI/CD
Set score thresholds in CI to automatically catch regressions:
```yaml theme={"theme":{"light":"github-light","dark":"github-dark-dimmed"}}
- name: Run Evals
uses: braintrustdata/eval-action@v1
with:
api_key: ${{ secrets.BRAINTRUST_API_KEY }}
runtime: node
fail_on_regression: true
min_score: 0.7
```
The action fails the build if scores drop below thresholds or show significant regressions.
To select a baseline dynamically by git branch and dataset, use BTQL to find the most recent matching experiment. Always combine branch filtering with `dataset_id` to avoid comparing experiments run against different datasets:
```typescript theme={"theme":{"light":"github-light","dark":"github-dark-dimmed"}}
import Braintrust from "braintrust";
const client = new Braintrust({ apiKey: process.env.BRAINTRUST_API_KEY });
const response = await client.btql({
query: `
SELECT id, name
FROM experiment
WHERE project_id = 'your-project-id'
AND (source->>'branch') ILIKE 'main%'
AND dataset_id = 'your-dataset-id'
ORDER BY created DESC
LIMIT 1
`,
});
const baselineId = response.data?.[0]?.id;
```
```python theme={"theme":{"light":"github-light","dark":"github-dark-dimmed"}}
import os
from braintrust import Braintrust
client = Braintrust(api_key=os.environ["BRAINTRUST_API_KEY"])
response = client.btql(query="""
SELECT id, name
FROM experiment
WHERE project_id = 'your-project-id'
AND (source->>'branch') ILIKE 'main%'
AND dataset_id = 'your-dataset-id'
ORDER BY created DESC
LIMIT 1
""")
data = response.get("data", [])
baseline_id = data[0].get("id") if data else None
```
## Next steps
* [Interpret results](/evaluate/interpret-results) — detailed guide to the experiments table
* [Use Loop](/loop) — query experiment data with natural language
* [Hill climbing](/evaluate/run-evaluations) — use prior outputs as baselines for iterative improvement
* [Model and provider comparison](/cookbook/recipes/ModelComparison) — compare many experiments using metadata grouping and charts
* [Write scorers](/evaluate/write-scorers) to measure what matters
* [Run evaluations in CI/CD](/evaluate/run-evaluations)
 *
*  *
*  Summary and Summary table layouts hide individual test case rows. Switch to **List** or **Grid** to drill into specific test cases.
## Share results
Braintrust gives you several options depending on who you're sharing with and what they need to do with the results.
* **Download as CSV or JSON** — for further analysis, importing into another tool, or sharing raw data. Click
Summary and Summary table layouts hide individual test case rows. Switch to **List** or **Grid** to drill into specific test cases.
## Share results
Braintrust gives you several options depending on who you're sharing with and what they need to do with the results.
* **Download as CSV or JSON** — for further analysis, importing into another tool, or sharing raw data. Click